Infrastructure and operations can feel like spinning plates. You juggle servers, deployments, monitoring alerts, security patches, and root cause analysis—all in different consoles. One slip and users notice. What if you had digital teammates handling log analysis, incident triage, capacity planning, patch deployment, and compliance checks? You’d focus on innovation, not firefighting.
In this guide, you’ll learn how to build DevOps automation agents with Neura AI’s platform. We’ll explore each agent’s purpose, real-world use cases, and a step-by-step setup. By the end, your ops team will breathe easier and your apps will hum along smoothly.
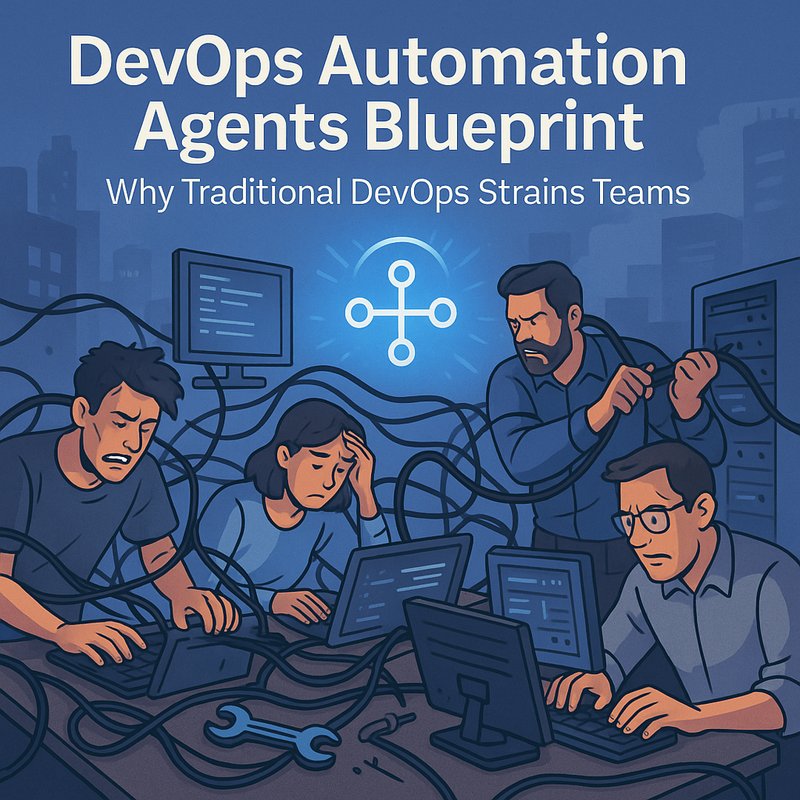
Why Traditional DevOps Strains Teams
I’ve seen teams struggle under the weight of alerts and tickets. Here’s what usually happens:
• Alerts flood Slack or email at 3 a.m.
• You log into multiple dashboards (AWS, Google Cloud, Datadog)
• Manual escalations waste precious time
• Patching servers is a copy-paste ritual
• Capacity surprises cause downtime
• Compliance scans feel like a quarterly chore
Ops burnout is real. The bottom line? You need agents that act like junior SREs—proactive, reliable, and tireless.
Your DevOps Agent Lineup
Imagine a crew of bots, each with a clear mandate. They connect to your tools, follow your playbooks, and shout when human insight is needed.
Incident Triage Agent
First things first. When PagerDuty or Opsgenie rings at 3 a.m., the Incident Triage Agent will:
- Pull new incidents via Neura Router from tools like PagerDuty or VictorOps
- Classify severity using past incident metadata (downtime, error type)
- Gather relevant logs from Elasticsearch or Splunk
- Summarize the root cause (e.g., out-of-memory, 502 errors)
- Post a concise summary and remediation steps to Slack or Teams
Your on-call engineer gets context in one glance, not hours of log sifting.
Log Analysis Agent
Logs are a goldmine… until they become walls of text. A Log Analysis Agent can:
• Ingest logs from AWS CloudWatch, Google Stackdriver, or Datadog via Neura Router
• Spot error patterns or spikes in latency
• Use Neura Artifacto to extract anomalies (spikes, timeouts)
• Correlate events with recent deploys (backed by GitHub links)
• Create reports in Confluence or Google Docs
Instead of manual grep commands, you get structured insight. Useful when you need to debug a memory leak at midnight.
Capacity Planning Agent
Outages often start with a capacity crunch. A Capacity Planning Agent will:
- Pull CPU, memory, and disk usage metrics from AWS CloudWatch or Prometheus
- Forecast demand with simple linear models (or more advanced ML via Neura Router)
- Recommend scaling actions (spin up nodes, shift traffic)
- Schedule auto-scaling group adjustments
- Send weekly capacity health dashboards to PagerDuty and email
Avoid that dreaded “weird load spike” conversation with stakeholders. Stay ahead of growth.
Patch & Configuration Agent
Keeping servers secure is non-negotiable. A Patch & Configuration Agent can:
- Scan server inventories via AWS Systems Manager or Ansible Tower
- Check against known CVEs from the NIST NVD database (backlink: https://nvd.nist.gov)
- Automatically apply critical patches in a canary group
- Validate successful reboot and service health
- Log patch status in Google Sheets or your CMDB
No more manual SSHing. You meet compliance checks from auditors without breaking a sweat.
CI/CD Monitor Agent
Continuous delivery only works if pipelines run smoothly. A CI/CD Monitor Agent will:
• Watch your pipelines in Jenkins, GitHub Actions, or GitLab CI
• Detect failed builds or tests
• Retrigger jobs if failures match known flaky patterns
• Notify developers with clear failure logs and links
• Archive build artifacts in Amazon S3 or Google Cloud Storage
Developers spend less time chasing broken pipelines. Productivity goes up.
Security Audit Agent
Security scans are often an afterthought. A Security Audit Agent can:
- Pull scan results from tools like Snyk, Clair, or Nessus
- Classify findings by severity and code owner
- Suggest fixes based on previous PRs or Hacker News threads (backlink: https://news.ycombinator.com)
- Create tickets in Jira or GitHub Issues for each vulnerability
- Track remediation status and nudge owners
You’ll close the gap between finding a flaw and fixing it.
Compliance Reporting Agent
Regulators love paperwork. A Compliance Reporting Agent will:
- Extract configuration snapshots (firewall rules, IAM policies)
- Compare them to your internal policy doc
- Generate a PDF report with diffs and timestamps
- Archive records in Confluence or SharePoint
- Email auditors with a single click
Audits go from chaotic to button-click simple.
How Neura AI Powers These Agents
Could you script all this yourself? Sure. Then you’d face brittle integrations and prompt drift. Instead, lean on Neura AI’s tooling.
Neura Router: Your Integration Nexus
Router handles auth, rate limits, and data mapping for:
• Cloud providers (AWS, GCP, Azure)
• Monitoring tools (Datadog, New Relic, Prometheus)
• Chat apps (Slack, Teams)
• Infrastructure as Code (Terraform Cloud, GitHub)
• Issue trackers (Jira, GitHub Issues)
One call, clean JSON. No more juggling SDKs.

Neura Artifacto: Smart Log Chat
When you need to parse a 10GB log file, just ask Artifacto:
“Find all 503 errors between 2 a.m. and 4 a.m. on server group alpha”
Artifacto returns a structured list with timestamps and stack traces. Tweak prompts as your stack evolves.
Neura TSB: Voice Ops and Notes
Record postmortem blamelessly on Zoom. TSB gives:
• Speaker-labeled transcripts
• Action items in markdown
• Timeline summaries
Stop scribbling and trust the transcript.
Neura ESA and WEB: Team and Customer Support
When internal or external teams email requests (capacity upgrades, service questions), ESA can draft replies based on your templates and route tickets. Meanwhile, WEB can embed a chat widget on your status page so customers ask for real-time updates.
Real-World Scenarios
Fintech Platform Scaling for a Promotion
A fast-growing fintech firm ramps up for a marketing push. They need tight uptime.
- Capacity Planning Agent forecasts a 3x jump in traffic
- Patch Agent applies OS and database patches in canary nodes
- CI/CD Monitor ensures release pipeline stays green under new load
- Incident Triage Agent fires alerts to the ops channel with context
- Compliance Reporting Agent builds a monthly SOC2 report
They hit 99.99% uptime and no compliance surprises.
Media Streaming Service in Peak Season
A streaming startup during a sports season experiences spikes.
• Log Analysis Agent spots error pattern when CDN nodes misroute
• Capacity Planner spins up extra edge servers in AWS
• Security Audit Agent blocks a misconfigured port vectoring a DDoS risk
• CI/CD Monitor fixes a bad deploy before it reached production
• Compliance Agent logs network configs for auditors
They keep streams live and viewers happy.
Step-by-Step Setup
Ready to automate your operations? Here’s how to start.
1. Map Your Ops Workflow
Sketch each step: detection, classification, remediation, reporting. Note the tools you use at each stage.
2. Connect with Neura Router
- Add API keys for AWS, Datadog, Slack, Jenkins, Jira
- Test simple calls like list-metrics, get-alerts, list-builds
- Confirm JSON outputs match what you need
3. Craft Prompts in Artifacto
Examples:
- “Summarize the last 1000 log lines for errors”
- “Extract IAM policy changes from this Terraform plan”
- “Compare yesterday’s capacity report with the week before”
4. Enable TSB for Postmortems
Record a mock incident review. Check that action items and timelines are accurate.
5. Pilot One Agent
Pick the Incident Triage Agent:
- Run for two weeks
- Measure mean time to acknowledge (MTTA) versus baseline
- Gather feedback from on-call engineers
- Tweak classification rules and channels
6. Scale to Other Agents
Add:
- Log Analysis and Capacity Planning
- Patch & Configuration and CI/CD Monitor
- Security Audit and Compliance Reporting
- Refine prompts and integrations as you learn
Tips for Smooth Sailing
• Start small: pilot with one mission-critical component
• Name agents clearly: “Triager”, “LogBot”, “ScaleGuard”
• Version your prompts: track changes in Artifacto
• Monitor agent logs: alert on failed API calls or bad prompts
• Involve your SRE team early: review outputs before full rollout
• Rotate API keys and apply least privilege
Security and Governance
Your infrastructure is your crown jewels. Neura AI ensures:
• Encryption in transit and at rest
• Role-based access per agent
• Audit logs with every action
• Configurable data retention for GDPR compliance
Need ISO27001 or SOC2? Deploy agents in your private cloud region.
The Bottom Line
Ops doesn’t have to be on-call hell. DevOps automation agents handle incident triage, log analysis, capacity planning, patching, CI/CD monitoring, security audits, and compliance reporting so your team focuses on building features. Map your flow, hook up Neura Router, set prompts in Artifacto, spin up TSB, pilot one agent, then scale. Ready to calm the chaos? Try DevOps automation agents today.
